August 22, 2026
Uptime Kuma and Alerting When Services Go Down
Why outage alerting matters in a homelab, how Uptime Kuma polls services, Docker Compose deployment, monitor types and Telegram notifications, plus limitations and a backup strategy.
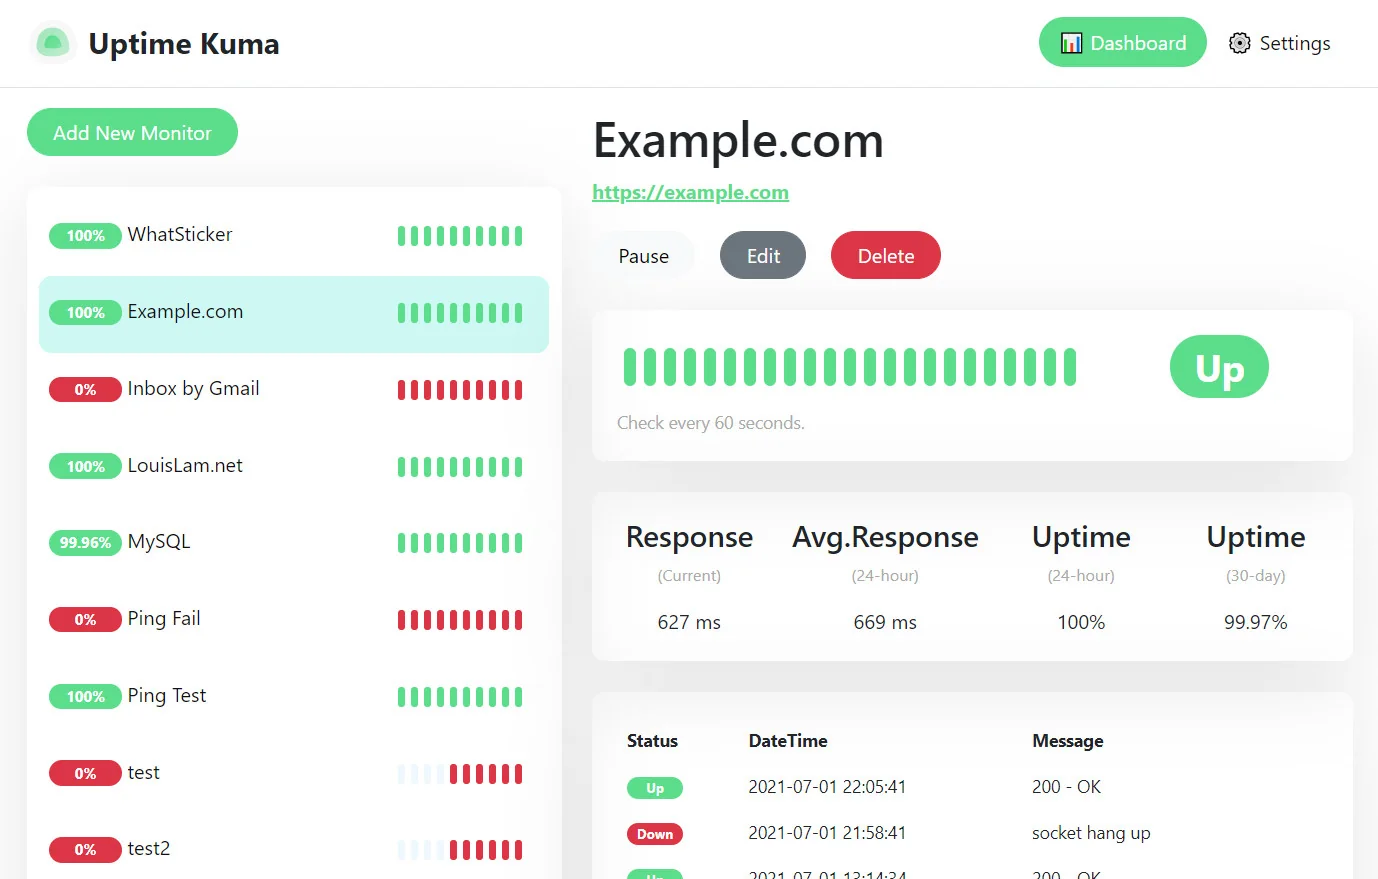
My homelab grew from a single experimental server into several services used day to day. Manual monitoring no longer worked, and the real problem was not services dying completely — it was services going down with nobody noticing until a user complained. I use Uptime Kuma to collect service status and send notifications when an outage happens, so downtime does not end up as a surprise.
Why Outage Alerting Matters
A service can stop responding without any visible sign on its host: the process runs, the logs are quiet, but requests hang. Scheduled checks matter beyond raw uptime — the goal is knowing about a failure within minutes. Uptime Kuma checks availability on a schedule and keeps a history of results, so down patterns can be traced without opening every service manually.
How It Works: Polling, History, and Storage
Uptime Kuma is a Node.js application running as a standalone server. Each monitor runs as a periodic task with a minimum interval of 20 seconds; every check result is stored as heartbeat history in a SQLite database inside the data folder (/app/data in the container). The dashboard, status pages, and uptime badges are computed from that history. Everything is local, so one instance covers the whole stack with no dependency on external services.
Installing with Docker Compose
Create a docker-compose.yml file in a dedicated directory:
services:
  uptime-kuma:
    image: louislam/uptime-kuma:1
    container_name: uptime-kuma
    restart: unless-stopped
    ports:
      - "3001:3001"
    volumes:
      - ./data:/app/data
Start it with:
docker-compose up -dOnce the container is running, open http://localhost:3001 and create the first admin account. The data lives in the ./data volume we mounted earlier; the web interface is intuitive enough to explore on your own.
Types of Monitors You Can Create
It is not just a plain HTTP check:
- HTTP/HTTPS — checks status codes, keywords, or URL redirects.
- Ping — checks basic connectivity.
- TCP port — verifies a given port is open.
- DNS — checks domain name resolution.
- Docker — monitors the status of Docker containers.
One dashboard is enough for a wide range of needs; no separate tool per protocol.
Retries and Transient Failures
Not every failure is real: a network drop, a slow DNS answer, a brief connection reset. Uptime Kuma lets you configure retries so you do not get pestered by false alarms. Set the retry count and interval in the monitor settings; a little patience leads to notifications that actually mean something.
Setting Up Notifications
Uptime Kuma supports dozens of providers: Telegram, Discord, Slack, Gotify, and email (SMTP). My choice is Telegram: every monitor is wired to a bot, so a down service shows up as a message on my phone without opening the dashboard, including a report when the server recovers. The notification path can fail independently from a monitor, for example a provider hostname that cannot be resolved; check DNS, outbound connectivity, and provider configuration before changing the monitor.
Status Pages and Badges
The public status page feature can hold selected monitors. Published monitors get badge endpoints with a fixed format, for example https://<uptime-host>/api/badge/<id>/status and /uptime. I embed those badges on the Projects page of this site, so each project’s status shows up as a small self-refreshing badge without opening the dashboard.
Cons and Limitations
- Single instance = single point of failure. If the Uptime Kuma host or container dies, all monitoring goes blind. It needs an external health check or a second instance on another host — “who watches the watchers” is a real question.
- SQLite needs a local volume. The database does not support network filesystems such as NFS; the data folder must be mounted on a local directory to stay uncorrupted.
- Limited authentication. The interface has no strong authentication mechanism by default; do not expose it directly to the internet without a security layer in front.
- Not real-time. The lowest interval is 20 seconds, and the status page caches results for a few minutes, so information is always slightly delayed.
- Badges only exist for published monitors on a status page; internal monitors have no public endpoint.
Security and Access
Use a VPN, a trusted network, or a reverse proxy with authentication in front of it. Uptime Kuma supports 2FA for the admin account; the data folder must be protected because it holds notification credentials.
Backup and Recovery
All monitor configuration, history, and notification settings live in the database inside the data folder. Backing up ./data is enough to restore everything; in my homelab this directory is included in the daily VM-level backups. Recovery is restoring the folder and starting the container again, with no reconfiguration from scratch. Do not forget to test your restores — a backup that has never been tested is the same as having no backup at all.
Conclusion
Uptime Kuma answers the core need: knowing sooner when a service is down, through one interface for HTTP, TCP, DNS, ping, and Docker. Simple deployment, persistent data, and Telegram notifications make it a good fit for a single-machine homelab. The honest limits: polling is not real-time, and a single instance still needs an external monitoring path plus tested backups.